Sector data: Agriculture
Note: Web browsers tend to cache data, which can on occasion interfere with the latest available data displaying. To ensure that the latest published data is shown in the chart, please clear your browsing history.
Agricultural exports by AGOA beneficiaries (combined) to United States
$ Actual, by HS2 code and program, 2000-2019 YTD, covering HS chapter 1-24, in ascending order by chapter code
Agricultural exports by AGOA beneficiaries (combined) to United States
$ Actual, by HS2 code and program, 2000-2019 YTD, covering HS chapter 1-24, in ascending order by chapter code
** On mobile & Desktop if the table is too wide, please use the scroll left and right to view the data off screen.
Chapter | Preference regime | Description (HS Chapter) | 2000 | 2001 | 2002 | 2003 | 2004 | 2005 | 2006 | 2007 | 2008 | 2009 | 2010 | 2011 | 2012 | 2013 | 2014 | 2015 | 2016 | 2017 | 2018 | 2019 | 2018 YTD to December | 2019 YTD to December | YoY change 2018-2019 YTD |
---|---|---|---|---|---|---|---|---|---|---|---|---|---|---|---|---|---|---|---|---|---|---|---|---|---|
Total: | 821,234,637 | 764,849,915 | 832,348,601 | 1,089,935,700 | 1,105,366,637 | 1,276,266,329 | 1,226,534,409 | 1,108,275,201 | 1,342,323,081 | 1,421,009,427 | 1,806,640,113 | 2,065,247,231 | 1,884,731,896 | 1,934,209,828 | 2,216,134,933 | 2,261,866,905 | 2,462,626,224 | 2,718,458,102 | 2,641,322,475 | 2,518,886,388 | 2,641,322,475 | 2,518,886,388 | -4.64% | ||
1 | No program claimed | LIVE ANIMALS | 7,345,089 | 8,371,382 | 5,532,269 | 8,816,714 | 12,912,118 | 16,292,759 | 19,363,613 | 15,637,328 | 17,182,940 | 12,622,234 | 13,354,095 | 12,122,476 | 12,102,559 | 9,885,636 | 12,755,644 | 12,709,415 | 12,376,732 | 13,524,593 | 10,138,109 | 13,814,165 | 10,138,109 | 13,814,165 | 36.26% |
1 | GSP (excluding GSP for LDBC only) | LIVE ANIMALS | 180,202 | 403,389 | 418,910 | 208,636 | 263,305 | 397,006 | 82,825 | 276,320 | 365,638 | 271,192 | 358,886 | 147,571 | 139,340 | 120,795 | 30,277 | 87,945 | 227,720 | 110,607 | 125,375 | 80,275 | 125,375 | 80,275 | -35.97% |
1 | AGOA (excluding GSP) | LIVE ANIMALS | 2,600 | 22,077 | 22,077 | -100% | |||||||||||||||||||
2 | No program claimed | MEAT AND EDIBLE MEAT OFFAL | 90,351 | 28,927 | 107,044 | 5,393 | 107,044 | 5,393 | -94.96% | ||||||||||||||||
3 | No program claimed | FISH AND CRUSTACEANS, MOLLUSCS AND OTHER AQUATIC INVERTEBRATES | 92,993,557 | 64,717,258 | 49,973,324 | 54,010,301 | 57,526,457 | 53,495,281 | 53,657,926 | 64,303,335 | 53,802,074 | 35,779,563 | 38,747,646 | 41,379,948 | 43,911,408 | 51,342,700 | 50,873,017 | 45,574,959 | 46,464,569 | 50,192,336 | 63,249,833 | 63,173,480 | 63,249,833 | 63,173,480 | -0.12% |
3 | GSP for LDBC countries only | FISH AND CRUSTACEANS, MOLLUSCS AND OTHER AQUATIC INVERTEBRATES | 4,800 | N/A | |||||||||||||||||||||
3 | GSP (excluding GSP for LDBC only) | FISH AND CRUSTACEANS, MOLLUSCS AND OTHER AQUATIC INVERTEBRATES | 29,003 | 8,351 | 15,436 | 11,786 | 13,446 | 3,000 | 39,468 | 25,280 | 31,288 | 44,128 | 50,230 | 10,800 | 85,469 | 44,733 | 90,150 | 109,217 | 142,082 | 135,313 | 174,283 | 135,313 | 174,283 | 28.80% | |
3 | AGOA (excluding GSP) | FISH AND CRUSTACEANS, MOLLUSCS AND OTHER AQUATIC INVERTEBRATES | 141,123 | 26,159 | 141,123 | 26,159 | -81.46% | ||||||||||||||||||
4 | No program claimed | DAIRY PRODUCE; BIRDS' EGGS; NATURAL HONEY; EDIBLE PRODUCTS OF ANIMAL ORIGIN, NESOI | 197,816 | 9,916 | 60,558 | 38,190 | 13,344 | 8,433 | 11,433 | 13,391 | 6,140 | 11,906 | 13,033 | 105,250 | 235,497 | 27,983 | 68,441 | 83,387 | 32,461 | 36,354 | 80,416 | 302,841 | 80,416 | 302,841 | 276.59% |
4 | GSP for LDBC countries only | DAIRY PRODUCE; BIRDS' EGGS; NATURAL HONEY; EDIBLE PRODUCTS OF ANIMAL ORIGIN, NESOI | 23,479 | 2,108 | 3,150 | 67,608 | 26,118 | 3,238 | 298,626 | 31,537 | 45,000 | 47,590 | 59,114 | 47,590 | 59,114 | 24.22% | |||||||||
4 | GSP (excluding GSP for LDBC only) | DAIRY PRODUCE; BIRDS' EGGS; NATURAL HONEY; EDIBLE PRODUCTS OF ANIMAL ORIGIN, NESOI | 13,762 | 7,293 | 12,096 | 6,388 | 9,640 | 3,443 | N/A | ||||||||||||||||
4 | AGOA (excluding GSP) | DAIRY PRODUCE; BIRDS' EGGS; NATURAL HONEY; EDIBLE PRODUCTS OF ANIMAL ORIGIN, NESOI | 4,305 | 5,506 | 43,200 | 8,400 | 15,000 | 289,413 | 55,027 | 105,719 | 220,032 | 525,708 | 367,949 | 668,457 | 55,045 | 668,457 | 55,045 | -91.77% | |||||||
5 | No program claimed | PRODUCTS OF ANIMAL ORIGIN, NESOI | 2,131,146 | 1,874,881 | 1,820,417 | 2,064,492 | 2,479,290 | 1,423,557 | 2,221,330 | 1,852,903 | 1,446,509 | 1,586,621 | 1,762,389 | 2,782,561 | 2,907,853 | 1,483,308 | 1,253,952 | 776,150 | 876,184 | 761,706 | 1,457,938 | 1,465,685 | 1,457,938 | 1,465,685 | 0.53% |
5 | GSP (excluding GSP for LDBC only) | PRODUCTS OF ANIMAL ORIGIN, NESOI | 48,430 | 113,300 | 81,885 | 44,798 | 34,804 | 25,020 | 26,305 | 55,875 | 77,266 | 32,337 | 46,389 | 23,788 | 101,550 | 71,574 | 51,125 | 40,472 | 84,305 | 19,171 | 57,728 | 26,590 | 57,728 | 26,590 | -53.94% |
5 | AGOA (excluding GSP) | PRODUCTS OF ANIMAL ORIGIN, NESOI | 26,730 | 4,655 | 26,730 | 4,655 | -82.59% | ||||||||||||||||||
6 | No program claimed | LIVE TREES AND OTHER PLANTS; BULBS, ROOTS AND THE LIKE; CUT FLOWERS AND ORNAMENTAL FOLIAGE | 1,926,275 | 1,776,346 | 1,925,138 | 2,049,631 | 2,076,787 | 1,986,051 | 1,804,262 | 2,139,229 | 1,473,138 | 846,598 | 1,138,774 | 903,067 | 1,069,413 | 1,198,263 | 1,014,876 | 1,306,613 | 1,165,006 | 2,146,523 | 1,228,591 | 1,511,831 | 1,228,591 | 1,511,831 | 23.05% |
6 | GSP (excluding GSP for LDBC only) | LIVE TREES AND OTHER PLANTS; BULBS, ROOTS AND THE LIKE; CUT FLOWERS AND ORNAMENTAL FOLIAGE | 3,345,316 | 3,054,195 | 3,758,187 | 3,307,107 | 4,305,316 | 4,062,271 | 5,201,867 | 6,482,044 | 7,209,966 | 5,575,281 | 5,352,541 | 5,358,450 | 6,198,676 | 7,602,123 | 8,728,496 | 9,404,869 | 9,839,980 | 9,229,447 | 7,566,879 | 9,070,633 | 7,566,879 | 9,070,633 | 19.87% |
6 | AGOA (excluding GSP) | LIVE TREES AND OTHER PLANTS; BULBS, ROOTS AND THE LIKE; CUT FLOWERS AND ORNAMENTAL FOLIAGE | 24,629 | 661,746 | 889,007 | 604,765 | 1,054,183 | 1,026,079 | 1,181,502 | 1,200,064 | 1,823,272 | 1,786,756 | 2,811,343 | 2,326,876 | 3,640,475 | 4,746,929 | 5,721,107 | 5,514,824 | 4,307,203 | 6,864,756 | 8,358,567 | 6,864,756 | 8,358,567 | 21.76% | |
7 | No program claimed | EDIBLE VEGETABLES AND CERTAIN ROOTS AND TUBERS | 495,857 | 571,667 | 296,711 | 167,785 | 69,561 | 477,078 | 288,684 | 751,058 | 3,515,379 | 1,527,941 | 1,246,640 | 698,468 | 648,039 | 873,001 | 1,275,180 | 908,930 | 604,131 | 877,517 | 2,068,014 | 3,433,238 | 2,068,014 | 3,433,238 | 66.02% |
7 | GSP for LDBC countries only | EDIBLE VEGETABLES AND CERTAIN ROOTS AND TUBERS | 2,380 | 3,000 | 3,000 | 6,750 | 11,266 | 2,123 | 5,250 | 3,000 | N/A | ||||||||||||||
7 | GSP (excluding GSP for LDBC only) | EDIBLE VEGETABLES AND CERTAIN ROOTS AND TUBERS | 1,164,704 | 1,199,485 | 2,275,133 | 2,528,210 | 3,216,313 | 3,629,450 | 4,193,999 | 5,736,597 | 6,653,340 | 6,255,939 | 7,301,689 | 9,359,303 | 10,048,930 | 12,228,797 | 12,137,579 | 12,284,474 | 11,474,147 | 11,631,603 | 4,261,058 | 4,849,267 | 4,261,058 | 4,849,267 | 13.80% |
7 | AGOA (excluding GSP) | EDIBLE VEGETABLES AND CERTAIN ROOTS AND TUBERS | 325,515 | 1,581,855 | 911,112 | 969,282 | 1,051,574 | 681,673 | 606,792 | 480,584 | 141,143 | 308,926 | 199,235 | 327,062 | 1,454,308 | 303,881 | 340,856 | 411,216 | 1,365,112 | 11,249,998 | 12,290,290 | 11,249,998 | 12,290,290 | 9.25% | |
8 | No program claimed | EDIBLE FRUIT AND NUTS; PEEL OF CITRUS FRUIT OR MELONS | 52,852,336 | 15,112,651 | 7,840,862 | 11,714,185 | 15,608,699 | 18,092,666 | 18,146,781 | 23,445,403 | 27,189,111 | 21,062,401 | 41,693,376 | 39,393,213 | 47,368,169 | 68,413,300 | 76,130,534 | 72,758,330 | 69,444,098 | 88,621,906 | 87,871,092 | 60,958,522 | 87,871,092 | 60,958,522 | -30.63% |
8 | GSP for LDBC countries only | EDIBLE FRUIT AND NUTS; PEEL OF CITRUS FRUIT OR MELONS | 127,431 | 182,366 | 530,029 | 121,831 | 9,010 | 108,435 | 315,779 | 197,316 | 420,976 | 4,200 | 238,140 | 238,140 | 306,340 | 1,056,425 | 555,626 | 1,056,425 | 555,626 | -47.41% | |||||
8 | GSP (excluding GSP for LDBC only) | EDIBLE FRUIT AND NUTS; PEEL OF CITRUS FRUIT OR MELONS | 2,251,269 | 3,095,828 | 2,934,628 | 5,540,825 | 11,076,815 | 4,933,034 | 4,970,756 | 1,852,368 | 733,347 | 1,005,216 | 1,732,024 | 1,473,022 | 5,510,252 | 4,804,159 | 2,245,533 | 4,297,216 | 8,686,761 | 6,392,026 | 7,017,150 | 9,977,356 | 7,017,150 | 9,977,356 | 42.19% |
8 | AGOA (excluding GSP) | EDIBLE FRUIT AND NUTS; PEEL OF CITRUS FRUIT OR MELONS | 28,623,924 | 39,284,799 | 60,876,994 | 70,608,804 | 76,267,000 | 85,166,484 | 65,625,767 | 62,598,521 | 61,572,217 | 104,371,648 | 100,871,339 | 114,681,356 | 124,602,832 | 136,547,307 | 183,472,800 | 158,073,623 | 192,215,688 | 246,323,998 | 252,749,861 | 246,323,998 | 252,749,861 | 2.61% | |
9 | No program claimed | COFFEE, TEA, MATE AND SPICES | 122,240,685 | 165,971,281 | 183,790,851 | 262,068,550 | 214,385,447 | 131,644,003 | 137,591,687 | 163,266,669 | 201,487,175 | 173,630,050 | 225,737,550 | 297,137,659 | 287,179,821 | 267,593,626 | 324,649,617 | 400,125,698 | 472,774,429 | 751,004,528 | 844,836,346 | 711,426,959 | 844,836,346 | 711,426,959 | -15.79% |
9 | GSP (excluding GSP for LDBC only) | COFFEE, TEA, MATE AND SPICES | 1,216,828 | 1,516,826 | 2,101,690 | 1,777,113 | 1,459,784 | 2,089,242 | 1,389,847 | 1,499,451 | 1,729,518 | 1,202,088 | 1,574,049 | 1,040,380 | 1,550,028 | 2,181,027 | 2,147,619 | 2,310,285 | 2,101,418 | 1,561,120 | 1,516,118 | 2,123,039 | 1,516,118 | 2,123,039 | 40.03% |
9 | AGOA (excluding GSP) | COFFEE, TEA, MATE AND SPICES | 2,700 | 10,240 | 17,942 | 33,849 | 13,302 | 9,007 | 9,321 | 30,897 | 13,917 | 195,014 | 524,970 | 555,555 | 319,931 | 555,555 | 319,931 | -42.41% | |||||||
10 | No program claimed | CEREALS | 19,614 | 22,000 | 67,805 | 25,785 | 42,863 | 22,803 | 431,181 | 104,944 | 99,225 | 116,952 | 73,272 | 26,337 | 173,809 | 1,079,812 | 717,882 | 1,184,195 | 665,315 | 816,208 | 1,046,275 | 816,208 | 1,046,275 | 28.19% | |
10 | GSP for LDBC countries only | CEREALS | 44,000 | 58,000 | 112,000 | 125,375 | 121,085 | 82,270 | 12,532 | 9,356 | 25,600 | 132,000 | 13,565 | 65,691 | 18,705 | 28,700 | 20,426 | 152,124 | 2,790 | 9,660 | 2,790 | 9,660 | 246.24% | ||
10 | GSP (excluding GSP for LDBC only) | CEREALS | 9,408 | 2,241 | N/A | ||||||||||||||||||||
10 | AGOA (excluding GSP) | CEREALS | 35,090 | 171,420 | 33,030 | 48,000 | 10,521 | 4,000 | 210,263 | 175,998 | 51,704 | 127,736 | 484,570 | 2,347,120 | 2,048,007 | 730,531 | 1,320,949 | 470,891 | 871,898 | 470,891 | 871,898 | 85.16% | |||
11 | No program claimed | MILLING INDUSTRY PRODUCTS; MALT; STARCHES; INULIN; WHEAT GLUTEN | 271,866 | 986,932 | 537,324 | 971,257 | 273,123 | 391,279 | 1,364,099 | 486,313 | 395,404 | 310,645 | 267,789 | 391,391 | 324,767 | 423,477 | 1,130,959 | 1,811,802 | 2,037,826 | 3,010,713 | 3,689,419 | 3,053,889 | 3,689,419 | 3,053,889 | -17.23% |
11 | GSP for LDBC countries only | MILLING INDUSTRY PRODUCTS; MALT; STARCHES; INULIN; WHEAT GLUTEN | 2,900 | 2,090 | 14,496 | 41,239 | 28,765 | 7,116 | 2,100 | 43,130 | 2,975 | 2,409 | 4,977 | 2,409 | 4,977 | 106.60% | |||||||||
11 | GSP (excluding GSP for LDBC only) | MILLING INDUSTRY PRODUCTS; MALT; STARCHES; INULIN; WHEAT GLUTEN | 292,160 | 280,162 | 362,725 | 700,381 | 758,053 | 844,173 | 379,482 | 584,166 | 526,669 | 766,880 | 1,107,597 | 688,784 | 842,643 | 1,143,509 | 1,193,117 | 1,999,834 | 2,275,185 | 2,083,086 | 1,943,430 | 3,147,126 | 1,943,430 | 3,147,126 | 61.94% |
11 | AGOA (excluding GSP) | MILLING INDUSTRY PRODUCTS; MALT; STARCHES; INULIN; WHEAT GLUTEN | 4,650 | 27,500 | 8,855 | 5,833 | 11,214 | 11,710 | 19,668 | 57,753 | 164,058 | 293,702 | 235,176 | 522,791 | 1,936,689 | 1,036,192 | 1,936,689 | 1,036,192 | -46.50% | ||||||
12 | No program claimed | OIL SEEDS AND OLEAGINOUS FRUITS; MISCELLANEOUS GRAINS, SEEDS AND FRUITS; INDUSTRIAL OR MEDICINAL PLANTS; STRAW AND FODDER | 16,188,886 | 17,432,161 | 12,552,385 | 16,972,389 | 20,480,673 | 22,827,214 | 21,332,868 | 30,935,372 | 43,958,179 | 49,646,697 | 36,665,305 | 28,647,465 | 35,495,216 | 37,976,161 | 37,794,151 | 40,865,715 | 58,959,762 | 45,210,655 | 48,193,065 | 48,668,127 | 48,193,065 | 48,668,127 | 0.99% |
12 | GSP for LDBC countries only | OIL SEEDS AND OLEAGINOUS FRUITS; MISCELLANEOUS GRAINS, SEEDS AND FRUITS; INDUSTRIAL OR MEDICINAL PLANTS; STRAW AND FODDER | 1,838,934 | N/A | |||||||||||||||||||||
12 | GSP (excluding GSP for LDBC only) | OIL SEEDS AND OLEAGINOUS FRUITS; MISCELLANEOUS GRAINS, SEEDS AND FRUITS; INDUSTRIAL OR MEDICINAL PLANTS; STRAW AND FODDER | 250,392 | 179,900 | 358,690 | 346,109 | 433,311 | 347,520 | 448,164 | 643,078 | 1,102,532 | 510,110 | 1,045,858 | 807,839 | 1,952,072 | 2,796,364 | 1,293,017 | 1,690,774 | 3,493,018 | 3,536,430 | 5,307,493 | 4,754,029 | 5,307,493 | 4,754,029 | -10.43% |
12 | AGOA (excluding GSP) | OIL SEEDS AND OLEAGINOUS FRUITS; MISCELLANEOUS GRAINS, SEEDS AND FRUITS; INDUSTRIAL OR MEDICINAL PLANTS; STRAW AND FODDER | 8,069 | 5,138 | 32,715 | 16,200 | 18,700 | 3,319 | 34,336 | 19,544 | 24,428 | 89,602 | 104,168 | 1,031,607 | 376,653 | 1,031,607 | 376,653 | -63.49% | |||||||
13 | No program claimed | LAC; GUMS; RESINS AND OTHER VEGETABLE SAPS AND EXTRACTS | 16,168,553 | 16,418,030 | 14,474,486 | 12,294,915 | 16,849,809 | 26,854,514 | 31,912,676 | 17,130,243 | 16,525,836 | 15,790,297 | 12,035,474 | 15,479,712 | 21,156,505 | 21,804,756 | 21,679,564 | 19,915,670 | 21,907,148 | 29,798,807 | 17,636,224 | 13,083,403 | 17,636,224 | 13,083,403 | -25.82% |
13 | GSP for LDBC countries only | LAC; GUMS; RESINS AND OTHER VEGETABLE SAPS AND EXTRACTS | 56,000 | N/A | |||||||||||||||||||||
13 | GSP (excluding GSP for LDBC only) | LAC; GUMS; RESINS AND OTHER VEGETABLE SAPS AND EXTRACTS | 73,600 | 66,870 | 205,934 | 13,018 | 5,781 | 8,250 | 77,695 | 83,098 | 8,400 | 82,440 | 51,109 | 138,200 | 1,001,585 | 681,632 | 1,444,650 | 536,736 | 1,060,926 | 604,256 | 1,060,926 | 604,256 | -43.04% | ||
13 | AGOA (excluding GSP) | LAC; GUMS; RESINS AND OTHER VEGETABLE SAPS AND EXTRACTS | 8,250 | 4,264 | 151,362 | 2,612 | 151,362 | 2,612 | -98.27% | ||||||||||||||||
14 | No program claimed | VEGETABLE PLAITING MATERIALS AND VEGETABLE PRODUCTS, NESOI | 217,524 | 85,398 | 216,060 | 239,163 | 160,847 | 722,581 | 120,969 | 221,185 | 402,601 | 380,291 | 371,039 | 562,558 | 252,794 | 497,568 | 804,210 | 319,551 | 311,707 | 189,194 | 644,312 | 754,423 | 644,312 | 754,423 | 17.09% |
14 | GSP for LDBC countries only | VEGETABLE PLAITING MATERIALS AND VEGETABLE PRODUCTS, NESOI | 468,035 | 116,169 | 46,800 | 200,421 | 311,794 | 112,594 | 18,722 | 9,680 | 10,560 | 11,220 | N/A | ||||||||||||
14 | GSP (excluding GSP for LDBC only) | VEGETABLE PLAITING MATERIALS AND VEGETABLE PRODUCTS, NESOI | 512,107 | 524,364 | 426,288 | 400,736 | 264,899 | 295,980 | 304,669 | 226,439 | 117,381 | 122,574 | 232,938 | 219,011 | 135,017 | 308,974 | 437,437 | 215,351 | 292,384 | 326,766 | 260,235 | 295,730 | 260,235 | 295,730 | 13.64% |
14 | AGOA (excluding GSP) | VEGETABLE PLAITING MATERIALS AND VEGETABLE PRODUCTS, NESOI | 21,721 | 30,076 | 28,546 | 55,614 | 77,465 | 88,050 | 121,860 | 88,050 | 121,860 | 38.40% | |||||||||||||
15 | No program claimed | ANIMAL OR VEGETABLE FATS AND OILS AND THEIR CLEAVAGE PRODUCTS; PREPARED EDIBLE FATS; ANIMAL OR VEGETABLE WAXES | 1,830,359 | 6,813,963 | 1,301,676 | 4,195,866 | 2,532,034 | 3,917,134 | 3,261,075 | 3,309,635 | 4,039,671 | 3,864,805 | 4,884,562 | 4,410,954 | 7,495,857 | 7,606,010 | 9,925,965 | 16,737,569 | 13,188,283 | 15,003,617 | 16,022,200 | 19,463,641 | 16,022,200 | 19,463,641 | 21.48% |
15 | GSP for LDBC countries only | ANIMAL OR VEGETABLE FATS AND OILS AND THEIR CLEAVAGE PRODUCTS; PREPARED EDIBLE FATS; ANIMAL OR VEGETABLE WAXES | 4,250 | 2,730 | 2,035 | 21,546 | 2,035 | 21,546 | 958.77% | ||||||||||||||||
15 | GSP (excluding GSP for LDBC only) | ANIMAL OR VEGETABLE FATS AND OILS AND THEIR CLEAVAGE PRODUCTS; PREPARED EDIBLE FATS; ANIMAL OR VEGETABLE WAXES | 365,623 | 502,754 | 257,629 | 308,033 | 148,303 | 180,895 | 354,935 | 406,306 | 555,776 | 511,366 | 314,631 | 160,749 | 179,022 | 324,606 | 530,361 | 683,859 | 1,117,196 | 1,297,458 | 1,718,540 | 2,455,132 | 1,718,540 | 2,455,132 | 42.86% |
15 | AGOA (excluding GSP) | ANIMAL OR VEGETABLE FATS AND OILS AND THEIR CLEAVAGE PRODUCTS; PREPARED EDIBLE FATS; ANIMAL OR VEGETABLE WAXES | 241,853 | 191,299 | 468,603 | 24,969 | 14,223,923 | 22,176 | 45,665 | 2,046,048 | 2,720 | 4,568 | 16,489 | 6,600 | 2,325 | 347,409 | 113,047 | 347,409 | 113,047 | -67.46% | |||||
16 | No program claimed | EDIBLE PREPARATIONS OF MEAT, FISH, CRUSTACEANS, MOLLUSCS OR OTHER AQUATIC INVERTEBRATES | 889,570 | 639,366 | 509,667 | 140,583 | 781,560 | 488,641 | 113,440 | 12,003,150 | 11,339,837 | 22,573,014 | 6,747,396 | 19,363,405 | 28,606,279 | 43,768,015 | 43,016,368 | 41,099,168 | 40,277,016 | 34,298,388 | 47,659,548 | 53,098,725 | 47,659,548 | 53,098,725 | 11.41% |
16 | GSP for LDBC countries only | EDIBLE PREPARATIONS OF MEAT, FISH, CRUSTACEANS, MOLLUSCS OR OTHER AQUATIC INVERTEBRATES | 123,620 | 8,650 | 30,455 | N/A | |||||||||||||||||||
16 | GSP (excluding GSP for LDBC only) | EDIBLE PREPARATIONS OF MEAT, FISH, CRUSTACEANS, MOLLUSCS OR OTHER AQUATIC INVERTEBRATES | 28,140 | 3,850 | 18,000 | 16,031 | 20,952 | 60,321 | 901,195 | 2,901,378 | 882,934 | 23,092 | 3,500 | 19,230 | 55,484 | 146,718 | 130,807 | 166,158 | 130,807 | 166,158 | 27.03% | ||||
16 | AGOA (excluding GSP) | EDIBLE PREPARATIONS OF MEAT, FISH, CRUSTACEANS, MOLLUSCS OR OTHER AQUATIC INVERTEBRATES | 47,108 | 46,116 | 3,414,606 | 35,573,461 | 3,687,817 | 1,612,224 | 396,422 | 2,345,239 | 1,135,881 | 328,243 | 707,766 | 760,086 | 658,430 | 6,060,529 | 35,362,192 | 53,280,799 | 35,362,192 | 53,280,799 | 50.67% | ||||
17 | No program claimed | SUGARS AND SUGAR CONFECTIONERY | 7,210,278 | 291,102 | 484,758 | 276,463 | 302,458 | 675,487 | 724,574 | 1,068,631 | 680,226 | 138,774 | 295,551 | 315,353 | 828,309 | 1,155,980 | 1,747,558 | 1,648,388 | 1,400,344 | 2,170,283 | 2,441,527 | 2,491,105 | 2,441,527 | 2,491,105 | 2.03% |
17 | GSP (excluding GSP for LDBC only) | SUGARS AND SUGAR CONFECTIONERY | 56,655,969 | 38,233,697 | 47,198,458 | 30,352,773 | 30,945,184 | 44,595,446 | 52,558,909 | 20,753,978 | 7,552,437 | 32,063,618 | 78,488,567 | 25,201,367 | 55,369,063 | 9,251,804 | 55,452,239 | 37,560,276 | 38,969,051 | 52,629,611 | 25,213,707 | 32,365,218 | 25,213,707 | 32,365,218 | 28.36% |
17 | AGOA (excluding GSP) | SUGARS AND SUGAR CONFECTIONERY | 49,141 | 61,872 | 18,877 | 216,124 | 7,394,471 | 21,475,522 | 16,902,680 | 18,497,676 | 16,902,680 | 18,497,676 | 9.44% | ||||||||||||
18 | No program claimed | COCOA AND COCOA PREPARATIONS | 292,901,857 | 265,274,180 | 301,567,851 | 429,664,286 | 458,976,398 | 686,473,495 | 532,398,343 | 473,258,326 | 669,400,952 | 729,664,679 | 891,431,847 | 1,156,627,000 | 840,940,890 | 921,787,370 | 1,106,975,753 | 1,077,397,929 | 1,184,659,374 | 1,083,651,572 | 867,654,557 | 834,066,651 | 867,654,557 | 834,066,651 | -3.87% |
18 | GSP (excluding GSP for LDBC only) | COCOA AND COCOA PREPARATIONS | 18,137,414 | 10,834,528 | 21,365,067 | 40,016,259 | 32,543,867 | 19,137,010 | 16,940,028 | 24,905,324 | 25,543,001 | 59,237,240 | 145,850,130 | 115,194,690 | 159,151,684 | 122,535,524 | 97,342,051 | 82,827,048 | 108,839,623 | 95,256,193 | 67,450,789 | 88,643,339 | 67,450,789 | 88,643,339 | 31.42% |
18 | AGOA (excluding GSP) | COCOA AND COCOA PREPARATIONS | 54,387 | 47,815 | 25,639 | 22,410 | 43,042 | 39,918 | 30,925 | 331,121 | 9,845,368 | 986,466 | 9,845,368 | 986,466 | -89.98% | ||||||||||
19 | No program claimed | PREPARATIONS OF CEREALS, FLOUR, STARCH OR MILK; BAKERS' WARES | 117,003 | 225,413 | 235,929 | 274,398 | 152,490 | 185,013 | 144,959 | 206,328 | 545,667 | 831,223 | 229,632 | 312,417 | 361,173 | 289,291 | 282,708 | 437,891 | 593,614 | 975,594 | 1,184,268 | 836,501 | 1,184,268 | 836,501 | -29.37% |
19 | GSP for LDBC countries only | PREPARATIONS OF CEREALS, FLOUR, STARCH OR MILK; BAKERS' WARES | 2,900 | 2,900 | N/A | ||||||||||||||||||||
19 | GSP (excluding GSP for LDBC only) | PREPARATIONS OF CEREALS, FLOUR, STARCH OR MILK; BAKERS' WARES | 334,082 | 207,482 | 201,512 | 275,349 | 264,675 | 430,583 | 637,684 | 451,065 | 358,479 | 254,188 | 396,618 | 463,794 | 636,472 | 662,492 | 817,401 | 691,082 | 981,640 | 1,579,572 | 1,206,905 | 1,344,823 | 1,206,905 | 1,344,823 | 11.43% |
19 | AGOA (excluding GSP) | PREPARATIONS OF CEREALS, FLOUR, STARCH OR MILK; BAKERS' WARES | 8,130 | 43,303 | 57,137 | 65,815 | 20,295 | 7,729 | 16,877 | 19,288 | 100,796 | 25,019 | 12,986 | 72,807 | 170,467 | 262,633 | 369,556 | 626,525 | 585,321 | 626,525 | 585,321 | -6.58% | |||
20 | No program claimed | PREPARATIONS OF VEGETABLES, FRUIT, NUTS, OR OTHER PARTS OF PLANTS | 32,862,465 | 16,674,745 | 16,407,295 | 18,601,185 | 11,862,136 | 3,611,830 | 4,439,953 | 3,490,088 | 7,983,294 | 5,284,327 | 7,080,371 | 8,007,863 | 5,943,167 | 6,878,113 | 4,927,970 | 7,810,114 | 8,584,834 | 6,695,208 | 9,284,665 | 18,060,855 | 9,284,665 | 18,060,855 | 94.52% |
20 | GSP for LDBC countries only | PREPARATIONS OF VEGETABLES, FRUIT, NUTS, OR OTHER PARTS OF PLANTS | 35,404 | 10,000 | N/A | ||||||||||||||||||||
20 | GSP (excluding GSP for LDBC only) | PREPARATIONS OF VEGETABLES, FRUIT, NUTS, OR OTHER PARTS OF PLANTS | 2,331,401 | 2,111,168 | 2,101,280 | 943,675 | 2,380,973 | 2,206,717 | 1,397,056 | 1,932,627 | 6,872,588 | 3,645,591 | 4,532,715 | 3,288,052 | 2,030,213 | 3,634,568 | 2,501,027 | 3,530,390 | 2,281,783 | 2,529,448 | 2,018,706 | 2,800,569 | 2,018,706 | 2,800,569 | 38.73% |
20 | AGOA (excluding GSP) | PREPARATIONS OF VEGETABLES, FRUIT, NUTS, OR OTHER PARTS OF PLANTS | 5,503,074 | 16,384,674 | 15,559,120 | 5,820,394 | 8,595,447 | 14,112,866 | 13,871,329 | 19,235,731 | 19,343,969 | 18,396,111 | 17,676,008 | 17,586,575 | 18,734,548 | 27,278,436 | 27,498,322 | 15,555,192 | 23,378,410 | 26,384,751 | 24,871,101 | 26,384,751 | 24,871,101 | -5.74% | |
21 | No program claimed | MISCELLANEOUS EDIBLE PREPARATIONS | 1,415,101 | 2,915,236 | 4,926,920 | 4,257,925 | 4,603,389 | 3,992,603 | 6,428,457 | 6,212,221 | 7,622,170 | 7,711,408 | 11,378,077 | 12,487,898 | 10,723,765 | 12,605,441 | 11,659,102 | 13,582,861 | 18,757,382 | 18,524,858 | 10,860,811 | 6,356,946 | 10,860,811 | 6,356,946 | -41.47% |
21 | GSP (excluding GSP for LDBC only) | MISCELLANEOUS EDIBLE PREPARATIONS | 399,432 | 698,373 | 497,505 | 2,062,835 | 668,513 | 2,071,130 | 8,572,918 | 10,020,382 | 9,361,177 | 4,966,140 | 3,838,944 | 6,097,241 | 6,692,871 | 7,377,643 | 8,182,991 | 10,740,059 | 7,528,119 | 6,433,613 | 6,953,122 | 9,568,297 | 6,953,122 | 9,568,297 | 37.61% |
21 | AGOA (excluding GSP) | MISCELLANEOUS EDIBLE PREPARATIONS | 447,602 | 615,436 | 866,323 | 1,907,610 | 2,078,155 | 1,278,613 | 2,744,615 | 6,182,838 | 8,150,536 | 7,568,074 | 7,207,085 | 5,776,686 | 5,565,348 | 5,853,025 | 7,411,852 | 9,313,964 | 8,465,189 | 8,242,181 | 7,532,401 | 8,242,181 | 7,532,401 | -8.61% | |
22 | No program claimed | BEVERAGES, SPIRITS AND VINEGAR | 15,008,185 | 10,378,648 | 9,660,497 | 11,405,770 | 13,936,788 | 13,699,094 | 10,792,806 | 7,739,072 | 7,501,817 | 7,272,290 | 8,859,706 | 10,070,033 | 8,479,158 | 9,994,951 | 9,845,843 | 10,093,744 | 9,576,263 | 7,638,990 | 8,367,703 | 6,863,929 | 8,367,703 | 6,863,929 | -17.97% |
22 | GSP for LDBC countries only | BEVERAGES, SPIRITS AND VINEGAR | 30,400 | 5,502 | 66,863 | 9,500 | 16,701 | 15,564 | 14,250 | 15,876 | 16,758 | 16,758 | 47,703 | 49,236 | 48,211 | 98,377 | 93,352 | 98,377 | 93,352 | -5.11% | |||||
22 | GSP (excluding GSP for LDBC only) | BEVERAGES, SPIRITS AND VINEGAR | 193,941 | 844,739 | 819,007 | 1,058,603 | 3,470,401 | 4,798,526 | 6,185,756 | 7,652,226 | 9,556,295 | 8,539,870 | 9,108,541 | 7,854,738 | 9,721,897 | 10,365,935 | 9,850,219 | 10,711,951 | 8,904,042 | 8,951,981 | 2,651,570 | 1,545,155 | 2,651,570 | 1,545,155 | -41.73% |
22 | AGOA (excluding GSP) | BEVERAGES, SPIRITS AND VINEGAR | 15,458,311 | 19,097,603 | 27,313,609 | 32,786,029 | 46,829,332 | 57,374,405 | 55,387,351 | 53,799,968 | 43,915,441 | 52,759,899 | 47,657,887 | 62,116,065 | 68,714,699 | 51,992,522 | 51,638,313 | 44,109,195 | 56,730,456 | 57,771,174 | 56,250,151 | 57,771,174 | 56,250,151 | -2.63% | |
23 | No program claimed | RESIDUES AND WASTE FROM THE FOOD INDUSTRIES; PREPARED ANIMAL FEED | 7,460,267 | 11,535,500 | 10,652,181 | 5,672,506 | 9,363,260 | 6,730,737 | 8,395,292 | 8,163,183 | 12,968,320 | 8,683,215 | 10,634,829 | 11,558,196 | 16,460,951 | 14,185,541 | 10,246,411 | 7,429,891 | 8,106,184 | 5,719,931 | 6,144,550 | 9,314,852 | 6,144,550 | 9,314,852 | 51.60% |
23 | GSP (excluding GSP for LDBC only) | RESIDUES AND WASTE FROM THE FOOD INDUSTRIES; PREPARED ANIMAL FEED | 2,420 | 20,000 | 2,280 | 3,237 | 13,240 | 13,240 | N/A | ||||||||||||||||
23 | AGOA (excluding GSP) | RESIDUES AND WASTE FROM THE FOOD INDUSTRIES; PREPARED ANIMAL FEED | 4,659 | 5,668 | 7,480 | 3,886,000 | N/A | ||||||||||||||||||
24 | No program claimed | TOBACCO AND MANUFACTURED TOBACCO SUBSTITUTES | 34,106,262 | 18,199,485 | 13,005,964 | 13,809,429 | 13,488,758 | 9,530,473 | 17,709,401 | 6,206,162 | 1,940,656 | 3,656,635 | 3,039,943 | 2,585,466 | 4,131,048 | 7,007,132 | 4,279,524 | 1,451,043 | 2,331,621 | 1,722,396 | 1,644,938 | 2,964,610 | 1,644,938 | 2,964,610 | 80.23% |
24 | GSP for LDBC countries only | TOBACCO AND MANUFACTURED TOBACCO SUBSTITUTES | 23,594,680 | 15,769,149 | 1,728,641 | 19,225,674 | 23,895,031 | 30,542,726 | 26,215,506 | 28,062,347 | 9,732,434 | 22,270,915 | 4,948,495 | 3,072,686 | 1,897,652 | 900,090 | 2,672,028 | 1,146,618 | 2,749,428 | 1,473,417 | 2,749,428 | 1,473,417 | -46.41% | ||
24 | GSP (excluding GSP for LDBC only) | TOBACCO AND MANUFACTURED TOBACCO SUBSTITUTES | 496,353 | 1,294,630 | 31,284 | 31,284 | 49,666 | 80,483 | 190,080 | 190,080 | N/A | ||||||||||||||
24 | AGOA (excluding GSP) | TOBACCO AND MANUFACTURED TOBACCO SUBSTITUTES | 8,199,029 | 29,464,435 | 13,868,334 | 14,961,651 | 11,790,810 | 14,513,464 | 11,015,967 | 16,480,793 | 32,433,184 | 33,362,905 | 39,949,659 | 40,846,118 | 36,807,464 | 48,396,315 | 25,791,581 | 32,038,102 | 28,380,827 | 22,472,619 | 27,924,470 | 22,472,619 | 27,924,470 | 24.26% | |
Total: | 821,234,637 | 764,849,915 | 832,348,601 | 1,089,935,700 | 1,105,366,637 | 1,276,266,329 | 1,226,534,409 | 1,108,275,201 | 1,342,323,081 | 1,421,009,427 | 1,806,640,113 | 2,065,247,231 | 1,884,731,896 | 1,934,209,828 | 2,216,134,933 | 2,261,866,905 | 2,462,626,224 | 2,718,458,102 | 2,641,322,475 | 2,518,886,388 | 2,641,322,475 | 2,518,886,388 | -4.64% |
Source: USITC
Agricultural exports by AGOA beneficiary and program to United States
$ million, 2000-2019 YTD, covering HS chapter 1-24
Agricultural exports by AGOA beneficiary and program to United States
$ million, 2000-2019 YTD, covering HS chapter 1-24
** On mobile & Desktop if the table is too wide, please use the scroll left and right to view the data off screen.
Country | Import Programme | 2000 | 2001 | 2002 | 2003 | 2004 | 2005 | 2006 | 2007 | 2008 | 2009 | 2010 | 2011 | 2012 | 2013 | 2014 | 2015 | 2016 | 2017 | 2018 | 2019 | 2018 YTD to December | 2019 YTD to December | Change YTD2018/19 |
---|---|---|---|---|---|---|---|---|---|---|---|---|---|---|---|---|---|---|---|---|---|---|---|---|
Total: | 821.23 | 764.85 | 832.35 | 1,089.94 | 1,105.37 | 1,276.27 | 1,226.53 | 1,108.28 | 1,342.32 | 1,421.01 | 1,806.64 | 2,065.25 | 1,884.73 | 1,934.21 | 2,216.13 | 2,261.87 | 2,462.63 | 2,718.46 | 2,641.32 | 2,518.89 | 2,641.32 | 2,518.89 | -4.64% | |
Angola | No program claimed | 0.04 | 0.08 | 0.02 | 0.08 | 0.02 | -70.25% | |||||||||||||||||
Benin | No program claimed | 0.6 | 0.71 | 0.52 | 0.31 | 0.36 | 0.3 | 0.27 | 0.11 | 0.23 | 0.14 | 0.22 | 1.07 | 2.86 | 3.6 | 4 | 5 | 16.67 | 16.11 | 8 | 16.11 | 8.02 | -50.21% | |
Benin | GSP (excluding GSP for LDBC only) | 0.02 | 0.02 | 0.15 | 0.03 | -82.32% | ||||||||||||||||||
Benin | AGOA (excluding GSP) | 0.01 | -100% | |||||||||||||||||||||
Botswana | No program claimed | 0.08 | 0.14 | 0.02 | 0.04 | 0.12 | 0.01 | 0.03 | 268.43% | |||||||||||||||
Botswana | GSP (excluding GSP for LDBC only) | 0.03 | 0.02 | 0.04 | N/A | |||||||||||||||||||
Burkina Faso | No program claimed | 1 | 1 | 3 | 3 | 1 | 2 | 2 | 2 | 2 | 2.09 | 2.37 | 13.27% | |||||||||||
Burkina Faso | AGOA (excluding GSP) | 0.01 | 0.02 | 0.72 | 0.59 | 1.86 | 0.59 | 1.86 | 216.67% | |||||||||||||||
Burkina Faso | GSP (excluding GSP for LDBC only) | 0.01 | 0.71 | 0.38 | 0.3 | 0.86 | 0.3 | 0.86 | 190.33% | |||||||||||||||
Burkina Faso | GSP for LDBC countries only | 2 | N/A | |||||||||||||||||||||
Cabo Verde | AGOA (excluding GSP) | 1 | 1 | 1 | 1 | 2 | 0.84 | 1.79 | 112.66% | |||||||||||||||
Cabo Verde | No program claimed | 0.1 | 0.01 | 0.07 | 0.11 | 0.22 | 0.38 | 0.17 | 0.09 | 0.79 | 0.41 | 0.61 | 0.53 | 0.31 | 0.84 | 1 | 1 | 1 | 1 | 0.86 | 0.57 | -33.23% | ||
Cabo Verde | GSP (excluding GSP for LDBC only) | 0.02 | 0.01 | 0.02 | 0.01 | -100.00% | ||||||||||||||||||
Cabo Verde | GSP for LDBC countries only | 0.12 | 0.05 | 0.01 | N/A | |||||||||||||||||||
Cameroon | GSP (excluding GSP for LDBC only) | 3 | 3 | 6 | 11 | 31 | 36 | 33 | 21 | 14 | 13 | 20 | 19 | 14 | 19 | 14.37 | 18.72 | 30.24% | ||||||
Cameroon | No program claimed | 6 | 4 | 16 | 19 | 16 | 21 | 18 | 13 | 3 | 4 | 7 | 12 | 19 | 4 | 5 | 5 | 5 | 5 | 5 | 4 | 4.79 | 4.36 | -8.85% |
Cameroon | AGOA (excluding GSP) | 2 | 2.29 | 0.41 | -81.92% | |||||||||||||||||||
Cen African Rep | AGOA (excluding GSP) | 0.25 | N/A | |||||||||||||||||||||
Cen African Rep | No program claimed | 2 | 1 | 1 | 1 | 1 | 1 | 1 | 0.2 | 4364.48% | ||||||||||||||
Cen African Rep | GSP (excluding GSP for LDBC only) | N/A | ||||||||||||||||||||||
Chad | No program claimed | 5 | 5 | 5 | 4 | 7 | 15 | 19 | 6 | 10 | 9 | 6 | 7 | 9 | 12 | 10 | 10 | 9 | 10 | 7 | 4 | 7.05 | 4.45 | -36.89% |
Chad | GSP for LDBC countries only | N/A | ||||||||||||||||||||||
Comoros | No program claimed | 3.23 | 10 | 5 | 4 | 16.34 | 1.37 | 1.4 | 0.15 | 0.84 | 1.01 | 1.6 | 1.77 | 1.9 | 2.76 | 1.98 | 1.07 | 2.51 | 4.84 | 2.44 | 0.8 | 2.44 | 0.8 | -67.15% |
Congo-Brazza | No program claimed | 1 | 1 | 1 | 2 | 1 | 1 | 1 | 2 | 2 | 3 | 5 | 5 | 5 | 4 | 2 | 1 | 1 | 1 | 0.84 | 1.42 | 70.15% | ||
Congo-Brazza | GSP (excluding GSP for LDBC only) | 2 | 3 | 3 | 2 | 3 | 1 | 1 | 1 | 1 | 1.05 | 0.6 | 1.05 | 0.6 | -42.72% | |||||||||
Congo-Brazza | AGOA (excluding GSP) | N/A | ||||||||||||||||||||||
Cote d`Ivoire | No program claimed | 238 | 214 | 258 | 369 | 432 | 594 | 453 | 418 | 614 | 600 | 708 | 829 | 651 | 742 | 885 | 885 | 986 | 850 | 712 | 624.34 | 711.99 | 624.34 | -12.31% |
Cote d`Ivoire | GSP (excluding GSP for LDBC only) | 22 | 13 | 22 | 41 | 38 | 22 | 19 | 21 | 19 | 41 | 79 | 48 | 96 | 85 | 75 | 58 | 70 | 65 | 41 | 61 | 40.85 | 61.08 | 49.52% |
Cote d`Ivoire | AGOA (excluding GSP) | 0.01 | 0.02 | 1 | 0.09 | 0.82 | 7.46 | 1.23 | 7.46 | 1.23 | -83.54% | |||||||||||||
Djibouti | No program claimed | 1 | 1 | 1 | 1 | 1 | 1 | 2 | 1 | 1 | 1 | 1 | 0.85 | 0.47 | -44.33% | |||||||||
Djibouti | GSP (excluding GSP for LDBC only) | 0.01 | 0.2 | 2088.88% | ||||||||||||||||||||
Djibouti | GSP for LDBC countries only | N/A | ||||||||||||||||||||||
Djibouti | AGOA (excluding GSP) | 0.15 | -100.00% | |||||||||||||||||||||
Eswatini | GSP (excluding GSP for LDBC only) | 12 | 6 | 7 | 7 | 15 | 14 | 5 | 6 | 18 | 18 | 14 | 10 | 13 | 2 | 8 | 2.35 | 8.35 | 254.85% | |||||
Eswatini | No program claimed | 0.6 | 0.4 | 0.51 | 0.64 | 0.16 | 0.95 | 0.91 | 0.91 | 0.8 | 0.4 | 2.62 | 0.06 | 0.16 | 0.27 | 0.78 | 1.18 | 0.47 | 0.29 | 2 | 0.29 | 2.13 | 630.44% | |
Eswatini | AGOA (excluding GSP) | 1 | 1 | 1 | 1 | 1 | 1 | 3 | 5 | 4 | 4 | 1 | 3.53 | 1.19 | -66.23% | |||||||||
Ethiopia | No program claimed | 25 | 25 | 21 | 26 | 32 | 48 | 53 | 69 | 112 | 80 | 98 | 117 | 96 | 103 | 110 | 147 | 132 | 168 | 161 | 144 | 161.03 | 143.77 | -10.72% |
Ethiopia | GSP (excluding GSP for LDBC only) | 1 | 1 | 1 | 1 | 2 | 4 | 9 | 5 | 3 | 3 | 3 | 3 | 5 | 7 | 7 | 6 | 4 | 3 | 3.52 | 3.42 | -2.98% | ||
Ethiopia | AGOA (excluding GSP) | 0.05 | 0.13 | 0.13 | 0.15 | 0.04 | 0.22 | 1 | 1 | 1 | 2 | 3 | 3 | 3.36 | 3.35 | -0.44% | ||||||||
Ethiopia | GSP for LDBC countries only | 1 | 0.1 | 0.1 | 0.43% | |||||||||||||||||||
Gabon | No program claimed | 1 | 1 | 1 | 1 | 1 | 0.02 | 0.29 | 1093.32% | |||||||||||||||
Gabon | GSP (excluding GSP for LDBC only) | N/A | ||||||||||||||||||||||
Gambia | No program claimed | 0.19 | 0.13 | 0.24 | 0.01 | 0.01 | 0.04 | 0.02 | 0.05 | 0.46 | 3 | 0.02 | 0.05 | 0.12 | 0.13 | 0.25 | 0.31 | 0.25 | 0.31 | 23.19% | ||||
Gambia | GSP (excluding GSP for LDBC only) | 0.02 | 0.06 | 190.66% | ||||||||||||||||||||
Gambia | GSP for LDBC countries only | N/A | ||||||||||||||||||||||
Gambia | AGOA (excluding GSP) | -100% | ||||||||||||||||||||||
Ghana | No program claimed | 68 | 56 | 26 | 7 | 18 | 31 | 68 | 52 | 28 | 86 | 151 | 243 | 149 | 170 | 192 | 216 | 217 | 221 | 163 | 219 | 163.02 | 219.28 | 34.51% |
Ghana | GSP (excluding GSP for LDBC only) | 2.95 | 2 | 3 | 5 | 5 | 5 | 7 | 7 | 7.61 | 15.16 | 43 | 39 | 41 | 28 | 20 | 23 | 32 | 29 | 23 | 21 | 23.07 | 21.29 | -7.69% |
Ghana | AGOA (excluding GSP) | 0.11 | 4 | 12 | 12 | 12.47 | 12.24 | -1.85% | ||||||||||||||||
Guinea | No program claimed | 4 | 1 | 2 | 1 | 1 | 1 | 1 | 1 | 2 | 1 | 1 | 1 | 1 | 2 | 1 | 1 | 1 | 1.3 | 0.78 | -40.14% | |||
Guinea | GSP (excluding GSP for LDBC only) | 0.1 | 0.05 | 0.07 | 0.11 | 64.43% | ||||||||||||||||||
Guinea | AGOA (excluding GSP) | 0.02 | 0.02 | -9.88% | ||||||||||||||||||||
Guinea | GSP for LDBC countries only | 11.40% | ||||||||||||||||||||||
Guinea-Bissau | No program claimed | 2 | 0.15 | 1.68 | 1012.05% | |||||||||||||||||||
Kenya | AGOA (excluding GSP) | 2 | 2 | 4 | 8 | 5 | 6 | 4 | 7 | 9 | 19 | 28 | 33 | 30 | 42 | 58 | 49 | 62 | 73 | 57 | 72.63 | 57.05 | -21.45% | |
Kenya | No program claimed | 34.15 | 38 | 37 | 36.62 | 40 | 46.38 | 50.94 | 47.55 | 57.95 | 49.56 | 56 | 64 | 71.2 | 57 | 72 | 76 | 77 | 97 | 71.14 | 56 | 71.14 | 55.77 | -21.60% |
Kenya | GSP (excluding GSP for LDBC only) | 0.83 | 0.6 | 1.25 | 1.04 | 3.01 | 2.37 | 0.9 | 1 | 1.26 | 1.24 | 2.97 | 2.53 | 2 | 3 | 3 | 3.54 | 2.61 | 2.48 | 2.18 | 3.64 | 2.18 | 3.64 | 66.72% |
Lesotho | AGOA (excluding GSP) | 0.07 | 0.06 | -17.48% | ||||||||||||||||||||
Lesotho | No program claimed | 0.04 | -100.00% | |||||||||||||||||||||
Liberia | No program claimed | 1 | 1 | 1 | 1 | 0.63 | 0.64 | 1.57% | ||||||||||||||||
Liberia | GSP for LDBC countries only | 0.01 | 374.69% | |||||||||||||||||||||
Liberia | GSP (excluding GSP for LDBC only) | 0.03 | -87.56% | |||||||||||||||||||||
Liberia | AGOA (excluding GSP) | 0.01 | -100.00% | |||||||||||||||||||||
Madagascar | No program claimed | 37 | 82 | 119 | 181 | 138 | 39 | 35 | 40 | 34 | 33 | 33 | 32 | 51 | 56 | 79 | 126 | 236 | 418 | 531 | 427 | 530.93 | 426.62 | -19.65% |
Madagascar | GSP (excluding GSP for LDBC only) | 3.09 | 2.96 | 2.77 | 0.47 | 0.37 | 0.39 | 0.53 | 0.13 | 0.2 | 0.36 | 0.5 | 1.09 | 2 | 2.2 | 2 | 1 | 1 | 1 | 0.42 | 0.74 | 76.35% | ||
Madagascar | AGOA (excluding GSP) | 0.03 | 0.02 | 0.18 | 0.49 | 170.64% | ||||||||||||||||||
Madagascar | GSP for LDBC countries only | N/A | ||||||||||||||||||||||
Malawi | AGOA (excluding GSP) | 7 | 30 | 13 | 10 | 10 | 12 | 8 | 14.01 | 31 | 36.97 | 43 | 40.58 | 39 | 53.3 | 35 | 43.53 | 35.35 | 30.27 | 41.23 | 30.27 | 41.23 | 36.21% | |
Malawi | No program claimed | 37.4 | 29 | 21 | 20 | 13 | 12 | 18 | 10 | 7.78 | 8 | 9.53 | 9 | 8.54 | 12 | 20.24 | 10 | 23.53 | 20.74 | 16.19 | 19.28 | 16.19 | 19.28 | 19.10% |
Malawi | GSP (excluding GSP for LDBC only) | 8 | 4 | 4 | 6 | 3 | 5 | 4 | 8 | 4 | 4 | 4 | 5 | 3 | 2 | 9 | 4 | 6 | 6 | 7 | 5.99 | 6.72 | 12.23% | |
Malawi | GSP for LDBC countries only | 23 | 15 | 2 | 19 | 23 | 31 | 26 | 28 | 10 | 21 | 5 | 3 | 2 | 1 | 3 | 1 | 3 | 2 | 3.04 | 1.78 | -41.38% | ||
Mali | No program claimed | 1 | 1 | 1 | 1 | 1 | 1 | 0.45 | 0.37 | -18.95% | ||||||||||||||
Mali | AGOA (excluding GSP) | 0.02 | -84.46% | |||||||||||||||||||||
Mali | GSP (excluding GSP for LDBC only) | 0.04 | -100.00% | |||||||||||||||||||||
Mali | GSP for LDBC countries only | N/A | ||||||||||||||||||||||
Mauritius | No program claimed | 19 | 4 | 5 | 8 | 11 | 14 | 18 | 27 | 27 | 34 | 20 | 32 | 41 | 52 | 57 | 54 | 53 | 49 | 61 | 71 | 60.66 | 71.08 | 17.17% |
Mauritius | GSP (excluding GSP for LDBC only) | 5 | 10 | 5 | 1 | 9 | 3 | 4 | 2 | 7 | 9 | 10 | 6 | 2 | 4 | 7 | 11 | 10 | 10 | 9.51 | 9.84 | 3.40% | ||
Mauritius | AGOA (excluding GSP) | 3 | 35 | 4 | 2 | 2 | 1 | 1 | 2 | 2 | 1 | 1.76 | 1.06 | -39.63% | ||||||||||
Mozambique | No program claimed | 13.2 | 1.34 | 0.94 | 0.19 | 1 | 1.78 | 3.39 | 2.56 | 1.98 | 4.58 | 9.47 | 9.86 | 13.41 | 18.85 | 13 | 17.82 | 21.34 | 26.92 | 23.4 | 19 | 23.4 | 18.54 | -20.75% |
Mozambique | GSP (excluding GSP for LDBC only) | 10.62 | 5.25 | 5.71 | 5.38 | 5.83 | 5.51 | 10.77 | 0.06 | 0.09 | 0.03 | 24.62 | 7.89 | 8.05 | 5.37 | 6.4 | 6.65 | 7 | 6.65 | 6.75 | 1.45% | |||
Mozambique | AGOA (excluding GSP) | 1 | 1 | 1 | 1 | 3 | 1 | 2 | 0.57 | 1.73 | 202.25% | |||||||||||||
Mozambique | GSP for LDBC countries only | 1 | 0.29 | -100.00% | ||||||||||||||||||||
Namibia | No program claimed | 19 | 12 | 6 | 10 | 8 | 6 | 5 | 8 | 4 | 1 | 1 | 4 | 6 | 7 | 5 | 1 | 0.37 | 1.36 | 270.33% | ||||
Namibia | GSP (excluding GSP for LDBC only) | 0.02 | 0.06 | 0.01 | 0.01 | 0.42 | 0.38 | -11.07% | ||||||||||||||||
Namibia | AGOA (excluding GSP) | N/A | ||||||||||||||||||||||
Niger | No program claimed | 2 | 0.42 | -100.00% | ||||||||||||||||||||
Niger | GSP (excluding GSP for LDBC only) | N/A | ||||||||||||||||||||||
Nigeria | No program claimed | 4 | 9 | 14 | 46 | 11 | 59 | 12 | 20 | 53 | 55 | 55 | 81 | 77 | 54 | 82 | 34 | 28 | 58 | 50 | 47 | 50.16 | 46.94 | -6.41% |
Nigeria | GSP (excluding GSP for LDBC only) | 2 | 1 | 1 | 1 | 1 | 2 | 2 | 2 | 3 | 2 | 2 | 3 | 3 | 2 | 5 | 2.29 | 4.79 | 108.92% | |||||
Nigeria | AGOA (excluding GSP) | 1 | 5 | 3 | 2 | 3.01 | 2.42 | -19.57% | ||||||||||||||||
Rwanda | No program claimed | 2 | 4 | 2 | 2 | 5 | 5 | 7 | 7 | 10 | 14 | 19 | 30 | 28 | 20 | 25 | 26 | 20 | 21 | 31 | 26 | 30.6 | 26.01 | -15% |
Rwanda | AGOA (excluding GSP) | 1 | 0.15 | 0.6 | 296.15% | |||||||||||||||||||
Rwanda | GSP for LDBC countries only | 0.46 | 0.26 | -42.84% | ||||||||||||||||||||
Rwanda | GSP (excluding GSP for LDBC only) | 0.04 | 1291.03% | |||||||||||||||||||||
Sao Tome & Prin | GSP (excluding GSP for LDBC only) | 0.03 | 0.02 | 0.02 | 0.04 | 0.02 | 0.03 | 0.05 | 0.06 | 0.05 | -19.84% | |||||||||||||
Sao Tome & Prin | No program claimed | N/A | ||||||||||||||||||||||
Senegal | AGOA (excluding GSP) | 14 | 5 | 33 | 50 | 32.54 | 50.04 | 53.77% | ||||||||||||||||
Senegal | No program claimed | 1.05 | 6.37 | 0.53 | 0.56 | 0.91 | 2.23 | 9.24 | 1.44 | 1.31 | 0.91 | 1.09 | 2.01 | 3.29 | 4 | 3.69 | 4 | 3.47 | 2.61 | 2.56 | 2.61 | 2.56 | -2% | |
Senegal | GSP (excluding GSP for LDBC only) | 0.17 | 0.25 | 47.88% | ||||||||||||||||||||
Sierra Leone | No program claimed | 1 | 1 | 1 | 1 | 1 | 1 | 2 | 1.27 | 1.51 | 19.39% | |||||||||||||
Sierra Leone | AGOA (excluding GSP) | 1 | 1 | 0.68 | 0.06 | -91.93% | ||||||||||||||||||
Sierra Leone | GSP (excluding GSP for LDBC only) | 0.01 | 0.01 | 0.05 | 0.02 | 0.03 | 80.82% | |||||||||||||||||
Sierra Leone | GSP for LDBC countries only | N/A | ||||||||||||||||||||||
South Africa | AGOA (excluding GSP) | 49 | 75 | 102 | 109 | 131 | 154 | 137 | 138 | 127 | 164 | 144 | 163 | 184 | 175 | 208 | 178 | 230 | 274 | 289 | 273.72 | 288.55 | 5.42% | |
South Africa | No program claimed | 154 | 91 | 66 | 73 | 73 | 67 | 69 | 60 | 58 | 46 | 58 | 69 | 65 | 77 | 80 | 75 | 79 | 83 | 96 | 102 | 96.01 | 102.09 | 6.34% |
South Africa | GSP (excluding GSP for LDBC only) | 26 | 14 | 30 | 20 | 21 | 29 | 40 | 34 | 27 | 42 | 46 | 31.64 | 64 | 29.23 | 50 | 34 | 43 | 40 | 21.16 | 24 | 21.16 | 24.07 | 13.76% |
Tanzania | No program claimed | 13 | 12 | 12 | 11 | 10 | 15 | 19 | 28 | 33 | 37 | 27 | 41 | 41 | 35 | 39 | 44 | 33 | 38 | 36 | 25 | 36.49 | 25.28 | -30.71% |
Tanzania | GSP (excluding GSP for LDBC only) | 1 | 1 | 0.21 | 0.34 | 66.79% | ||||||||||||||||||
Tanzania | AGOA (excluding GSP) | 1 | 3 | 1 | 1 | 0.56 | 0.08 | -86.10% | ||||||||||||||||
Tanzania | GSP for LDBC countries only | 0.62 | 0.49 | 1 | 0.05 | N/A | ||||||||||||||||||
Togo | No program claimed | 1.03 | 1.1 | 1.51 | 0.76 | 0.58 | 3.81 | 0.7 | 4.3 | 8.94 | 5.89 | 8.25 | 28.99 | 2 | 4.66 | 4.14 | 3.15 | 2.73 | 4 | 2.45 | 3 | 2.45 | 3.09 | 26.41% |
Togo | GSP (excluding GSP for LDBC only) | 0.02 | 0.12 | 376.47% | ||||||||||||||||||||
Togo | AGOA (excluding GSP) | 0.01 | 0.08 | 714.61% | ||||||||||||||||||||
Togo | GSP for LDBC countries only | 11.97% | ||||||||||||||||||||||
Uganda | No program claimed | 21 | 16 | 14 | 33 | 18 | 18 | 15 | 15 | 16 | 25 | 37 | 38 | 30 | 40 | 32 | 28 | 31 | 57 | 56 | 59 | 55.6 | 58.81 | 5.77% |
Uganda | GSP (excluding GSP for LDBC only) | 1 | 1 | 1 | 1 | 1 | 1 | 1 | 1 | 2 | 2 | 1.61 | 1.71 | 6.41% | ||||||||||
Uganda | AGOA (excluding GSP) | 0.01 | 0.01 | 0.43 | 0.38 | -12.34% | ||||||||||||||||||
Uganda | GSP for LDBC countries only | 1 | 0.03 | 0.01 | -59.53% | |||||||||||||||||||
Zambia | No program claimed | 1 | 1 | 1 | 1 | 2 | 1 | 1 | 1 | 1 | 1 | 1 | 1 | 1 | 1 | 1 | 0.71 | 0.95 | 32.86% | |||||
Zambia | AGOA (excluding GSP) | 0.11 | 0.07 | -39.73% | ||||||||||||||||||||
Zambia | GSP (excluding GSP for LDBC only) | 0.03 | -100.00% | |||||||||||||||||||||
Zambia | GSP for LDBC countries only | 0.04 | -100.00% | |||||||||||||||||||||
Total: | 821.23 | 764.85 | 832.35 | 1,089.94 | 1,105.37 | 1,276.27 | 1,226.53 | 1,108.28 | 1,342.32 | 1,421.01 | 1,806.64 | 2,065.25 | 1,884.73 | 1,934.21 | 2,216.13 | 2,261.87 | 2,462.63 | 2,718.46 | 2,641.32 | 2,518.89 | 2,641.32 | 2,518.89 | -4.64% |
Source: USITC
No data denotes 'no trade'
AGOA Beneficiaries' exports of fruit, vegetables and nuts under AGOA/GSP, to United States
$ '000, 2000-2018 YTD, covering fruit, vegetable and nut products
AGOA Beneficiaries' exports of fruit, vegetables and nuts under AGOA/GSP, to United States
$ '000, 2000-2018 YTD, covering fruit, vegetable and nut products
** On mobile & Desktop if the table is too wide, please use the scroll left and right to view the data off screen.
Preferences | HTS4 code and decription | 2000 | 2001 | 2002 | 2003 | 2004 | 2005 | 2006 | 2007 | 2008 | 2009 | 2010 | 2011 | 2012 | 2013 | 2014 | 2015 | 2016 | 2017 | 2017 YTD to Feb | 2018 YTD to Feb | YoY change 2017-2018 |
---|---|---|---|---|---|---|---|---|---|---|---|---|---|---|---|---|---|---|---|---|---|---|
AGOA (excluding GSP) | 0806 GRAPES, FRESH OR DRIED | 1,485 | 7,576 | 3,706 | 3,686 | 3,917 | 5,616 | 8,599 | 5,744 | 3,715 | 9,971 | 2,292 | 2,471 | 8,119 | 4,955 | 10,604 | 6,478 | 10,534 | 1,535 | 3,265 | 112.70% | |
AGOA (excluding GSP) | 0802 NUTS NESOI, FRESH OR DRIED | 7,320 | 10,406 | 18,773 | 27,008 | 26,554 | 15,800 | 473 | 1,352 | 2,269 | 3,659 | 5,613 | 7,521 | 5,885 | 7,149 | 8,147 | 6,288 | 9,552 | 967 | 1,293 | 33.70% | |
AGOA (excluding GSP) | 0714 CASSAVA (MANIOC), ARROWROOT, SALEP, JERUSALEM ARTICHOKES, SWEET POTATOES AND SIMILAR ROOTS ETC. (HIGH STARCH ETC. CONTENT), FRESH OR DRIED; SAGO PITH | 9 | 64 | 609 | 58 | 716 | 1135.50% | |||||||||||||||
AGOA (excluding GSP) | 0804 DATES, FIGS, PINEAPPLES, AVOCADOS, GUAVAS, MANGOES AND MANGOSTEENS, FRESH OR DRIED | 13 | 181 | 355 | 533 | 463 | 678 | 591 | 567 | 301 | 500 | 452 | 486 | 633 | 419 | 730 | 838 | 2,617 | 122 | 262 | 114.10% | |
AGOA (excluding GSP) | 0810 FRUIT NESOI, FRESH | 160 | 253 | 220 | N/A | |||||||||||||||||
AGOA (excluding GSP) | 0813 FRUIT, DRIED, NESOI (OTHER THAN THOSE OF HEADINGS 0801 TO 0806); MIXTURES OF NUTS OR DRIED FRUITS OF THIS CHAPTER | 96 | 48 | 410 | 118 | 87 | 700 | 360 | 344 | 72 | 394 | 495 | 410 | 490 | 494 | 1,009 | 2,046 | 1,722 | 261 | 157 | -39.90% | |
AGOA (excluding GSP) | 0713 LEGUMINOUS VEGETABLES, DRIED SHELLED | 40 | 493 | 157 | 109 | -30.60% | ||||||||||||||||
AGOA (excluding GSP) | 0709 VEGETABLES NESOI, FRESH OR CHILLED | 221 | 807 | 785 | 706 | 1,048 | 679 | 547 | 387 | 139 | 302 | 182 | 158 | 250 | 172 | 163 | 203 | 190 | 38 | 47 | 23.30% | |
AGOA (excluding GSP) | 0904 PEPPER OF THE GENUS PIPER; FRUITS OF THE GENUS CAPSICUM (PEPPERS) OR OF THE GENUS PIMENTA, DRIED, CRUSHED OR GROUND | 8 | 57 | 46 | N/A | |||||||||||||||||
AGOA (excluding GSP) | 0805 CITRUS FRUIT, FRESH OR DRIED | 19,707 | 21,016 | 37,172 | 39,253 | 45,232 | 62,282 | 43,955 | 39,572 | 37,742 | 48,491 | 43,601 | 46,449 | 56,757 | 51,910 | 60,277 | 56,363 | 42,760 | N/A | |||
AGOA (excluding GSP) | 0808 APPLES, PEARS AND QUINCES, FRESH | 3 | 51 | 461 | 10 | 14 | 90 | 130 | 482 | 883 | 832 | 410 | 371 | 606 | 679 | 115 | 202 | 79 | N/A | |||
AGOA (excluding GSP) | 0809 APRICOTS, CHERRIES, PEACHES (INCLUDING NECTARINES), PLUMS (INCLUDING PRUNE PLUMS) AND SLOES, FRESH | 29 | 21 | 181 | N/A | |||||||||||||||||
AGOA (excluding GSP) | 0708 LEGUMINOUS VEGETABLES, SHELLED OR UNSHELLED, FRESH OR CHILLED | 10 | 5 | 4 | 2 | 3 | 27 | 734 | 92 | 118 | 5 | 2 | 2 | -100.00% | ||||||||
AGOA (excluding GSP) | 0706 CARROTS, TURNIPS, SALAD BEETS, SALSIFY, RADISHES AND SIMILAR EDIBLE ROOTS, FRESH OR CHILLED | 2 | N/A | |||||||||||||||||||
AGOA (excluding GSP) | 0701 POTATOES (OTHER THAN SWEET POTATOES), FRESH OR CHILLED | 50 | 15 | N/A | ||||||||||||||||||
Subtotal - AGOA (excluding GSP) | 28,855 | 40,086 | 61,666 | 71,314 | 77,315 | 85,846 | 54,705 | 48,460 | 45,124 | 64,152 | 53,048 | 57,893 | 73,473 | 65,906 | 81,162 | 72,708 | 69,063 | 3,140 | 6,113 | 94.70% | ||
GSP | 0714 CASSAVA (MANIOC), ARROWROOT, SALEP, JERUSALEM ARTICHOKES, SWEET POTATOES AND SIMILAR ROOTS ETC. (HIGH STARCH ETC. CONTENT), FRESH OR DRIED; SAGO PITH | 1,024 | 1,076 | 1,514 | 2,424 | 2,508 | 3,057 | 3,445 | 3,887 | 4,371 | 5,621 | 6,274 | 7,074 | 7,961 | 9,573 | 9,213 | 8,579 | 7,852 | 8,950 | 784 | 884 | 12.60% |
GSP | 0804 DATES, FIGS, PINEAPPLES, AVOCADOS, GUAVAS, MANGOES AND MANGOSTEENS, FRESH OR DRIED | 60 | 89 | 85 | 54 | 132 | 457 | 139 | 226 | 276 | 397 | 582 | 802 | 958 | 1,576 | 672 | 918 | 1,712 | 1,032 | 283 | N/A | |
GSP | 0713 LEGUMINOUS VEGETABLES, DRIED SHELLED | 38 | 23 | 728 | 40 | 592 | 402 | 612 | 1,704 | 2,152 | 527 | 904 | 2,225 | 2,034 | 2,583 | 2,881 | 3,471 | 2,459 | 1,536 | 378 | 126 | -66.70% |
GSP | 0810 FRUIT NESOI, FRESH | 57 | 4 | 61 | 265 | 161 | 304 | 82 | 38 | 40 | 4.80% | |||||||||||
GSP | 0904 PEPPER OF THE GENUS PIPER; FRUITS OF THE GENUS CAPSICUM (PEPPERS) OR OF THE GENUS PIMENTA, DRIED, CRUSHED OR GROUND | 1,064 | 1,223 | 1,840 | 1,542 | 1,158 | 1,766 | 313 | 285 | 217 | 152 | 183 | 84 | 105 | 148 | 113 | 304 | 401 | 256 | 37 | 19 | -47.50% |
GSP | 0813 FRUIT, DRIED, NESOI (OTHER THAN THOSE OF HEADINGS 0801 TO 0806); MIXTURES OF NUTS OR DRIED FRUITS OF THIS CHAPTER | 52 | 148 | 65 | 94 | 5 | 3 | 3 | 14 | 105 | 80 | 336 | 849 | 979 | 602 | 413 | 6 | N/A | ||||
GSP | 0802 NUTS NESOI, FRESH OR DRIED | 2,319 | 2,898 | 2,702 | 5,587 | 10,851 | 4,998 | 4,950 | 1,545 | 164 | 98 | 1,045 | 427 | 1,490 | 362 | 273 | 1,979 | 6,069 | 4,968 | N/A | ||
GSP | 0803 BANANAS, INCLUDING PLANTAINS, FRESH OR DRIED | 10 | 14 | N/A | ||||||||||||||||||
GSP | 0708 LEGUMINOUS VEGETABLES, SHELLED OR UNSHELLED, FRESH OR CHILLED | 11 | 73 | 15 | 24 | 9 | 15 | 4 | 11 | N/A | ||||||||||||
GSP | 0805 CITRUS FRUIT, FRESH OR DRIED | 14 | 9 | 3 | N/A | |||||||||||||||||
GSP | 0807 MELONS (INCLUDING WATERMELONS) AND PAPAYAS (PAPAWS), FRESH | 6 | 2 | N/A | ||||||||||||||||||
GSP | 0704 CABBAGES, CAULIFLOWER, KOHLRABI, KALE AND SIMILAR EDIBLE BRASSICAS, FRESH OR CHILLED | 12 | N/A | |||||||||||||||||||
GSP | 0709 VEGETABLES NESOI, FRESH OR CHILLED | 16 | 6 | 11 | 5 | 5 | 8 | 2 | 5 | 12 | N/A | |||||||||||
GSP | 0703 ONIONS, SHALLOTS, GARLIC, LEEKS AND OTHER ALLIACEOUS VEGETABLES, FRESH OR CHILLED | 13 | 4 | 501 | N/A | |||||||||||||||||
Subtotal - GSP | 4,557 | 5,501 | 7,043 | 9,741 | 15,340 | 10,697 | 9,471 | 7,654 | 7,197 | 6,818 | 9,108 | 10,614 | 12,639 | 14,652 | 14,273 | 16,397 | 19,899 | 17,260 | 1,237 | 1,358 | 9.80% | |
No program claimed | 0801 COCONUTS, BRAZIL NUTS AND CASHEW NUTS, FRESH OR DRIED | 13,517 | 2,750 | 3,291 | 3,186 | 3,691 | 6,563 | 11,099 | 13,974 | 16,782 | 16,478 | 23,897 | 26,046 | 34,657 | 52,076 | 50,884 | 58,699 | 61,267 | 80,369 | 12,780 | 12,033 | -5.80% |
No program claimed | 0713 LEGUMINOUS VEGETABLES, DRIED SHELLED | 64 | 187 | 149 | 25 | 36 | 394 | 114 | 628 | 3,324 | 1,431 | 1,128 | 515 | 460 | 548 | 871 | 697 | 441 | 456 | 47 | 237 | 403.80% |
No program claimed | 0806 GRAPES, FRESH OR DRIED | 16,690 | 2,519 | 939 | 640 | 2,050 | 1,320 | 833 | 1,070 | 1,443 | 194 | 2,643 | 1,080 | 872 | 987 | 1,373 | 555 | 1,094 | 1,570 | 47 | 163 | 245.50% |
No program claimed | 0813 FRUIT, DRIED, NESOI (OTHER THAN THOSE OF HEADINGS 0801 TO 0806); MIXTURES OF NUTS OR DRIED FRUITS OF THIS CHAPTER | 186 | 45 | 65 | 8 | 9 | 79 | 24 | 15 | 28 | 124 | 246 | 347 | 166 | 300 | 973 | 1,762 | 87 | N/A | |||
No program claimed | 0708 LEGUMINOUS VEGETABLES, SHELLED OR UNSHELLED, FRESH OR CHILLED | 32 | 4 | 23 | 10 | 3 | 2 | 28 | 2 | 10 | 6 | 164 | 25 | 49 | 93.00% | |||||||
No program claimed | 0904 PEPPER OF THE GENUS PIPER; FRUITS OF THE GENUS CAPSICUM (PEPPERS) OR OF THE GENUS PIMENTA, DRIED, CRUSHED OR GROUND | 170 | 51 | 239 | 4 | 4 | 62 | 35 | 237 | 390 | 478 | 482 | 299 | 82 | 186 | 237 | 78 | 44 | 128 | 5 | 10 | 103.20% |
No program claimed | 0804 DATES, FIGS, PINEAPPLES, AVOCADOS, GUAVAS, MANGOES AND MANGOSTEENS, FRESH OR DRIED | 32 | 81 | 87 | 105 | 8 | 82 | 287 | 73 | 34 | 36 | 75 | 133 | 454 | 23 | 56 | 217 | 100 | 19 | 8 | -58.30% | |
No program claimed | 0803 BANANAS, INCLUDING PLANTAINS, FRESH OR DRIED | 2 | 3 | 13 | 3 | 12 | 2 | 10 | 6 | 17 | 44 | 13 | 11 | 43 | 44 | 104 | 43 | 2 | 2 | -12.20% | ||
No program claimed | 0802 NUTS NESOI, FRESH OR DRIED | 7,982 | 2,725 | 1,016 | 4,624 | 6,538 | 8,867 | 4,329 | 3,924 | 4,275 | 658 | 10,213 | 860 | 1,658 | 2,018 | 6,425 | 3,892 | 1,863 | 843 | N/A | ||
No program claimed | 0805 CITRUS FRUIT, FRESH OR DRIED | 8,311 | 539 | 257 | 588 | 268 | 796 | 476 | 75 | 9 | 611 | N/A | ||||||||||
No program claimed | 0703 ONIONS, SHALLOTS, GARLIC, LEEKS AND OTHER ALLIACEOUS VEGETABLES, FRESH OR CHILLED | 11 | N/A | |||||||||||||||||||
No program claimed | 0808 APPLES, PEARS AND QUINCES, FRESH | 5,872 | 6,450 | 2,185 | 2,489 | 3,043 | 509 | 1,325 | 1,099 | 402 | 791 | 427 | 1,165 | 1,317 | 1,193 | 747 | 1,454 | 576 | 599 | N/A | ||
No program claimed | 0809 APRICOTS, CHERRIES, PEACHES (INCLUDING NECTARINES), PLUMS (INCLUDING PRUNE PLUMS) AND SLOES, FRESH | 13 | 297 | 16 | N/A | |||||||||||||||||
No program claimed | 0810 FRUIT NESOI, FRESH | 187 | 30 | 14 | 4 | 19 | 18 | 11 | 16 | N/A | ||||||||||||
No program claimed | 0702 TOMATOES, FRESH OR CHILLED | 20 | N/A | |||||||||||||||||||
No program claimed | 0714 CASSAVA (MANIOC), ARROWROOT, SALEP, JERUSALEM ARTICHOKES, SWEET POTATOES AND SIMILAR ROOTS ETC. (HIGH STARCH ETC. CONTENT), FRESH OR DRIED; SAGO PITH | 4 | 85 | 73 | 23 | 9 | 39 | 155 | 23 | 56 | 4 | 21 | 28 | 41 | 130 | 172 | 57 | 7 | 6 | N/A | ||
No program claimed | 0701 POTATOES (OTHER THAN SWEET POTATOES), FRESH OR CHILLED | 8 | N/A | |||||||||||||||||||
No program claimed | 0709 VEGETABLES NESOI, FRESH OR CHILLED | 336 | 226 | 4 | 14 | 4 | 14 | 55 | 3 | 28 | 13 | 7 | 4 | N/A | ||||||||
Subtotal No program claimed | 53,387 | 15,694 | 8,316 | 11,755 | 15,668 | 18,590 | 18,458 | 21,419 | 26,851 | 20,108 | 38,906 | 30,849 | 39,508 | 57,971 | 60,958 | 66,163 | 66,620 | 86,059 | 12,925 | 12,588 | -2.60% | |
Total | 57,944 | 50,050 | 55,445 | 83,162 | 102,322 | 106,601 | 113,774 | 83,778 | 82,508 | 72,050 | 112,166 | 94,511 | 110,040 | 146,095 | 141,137 | 163,723 | 159,227 | 172,382 | 17,303 | 20,060 | 15.90% |
Source: USITC
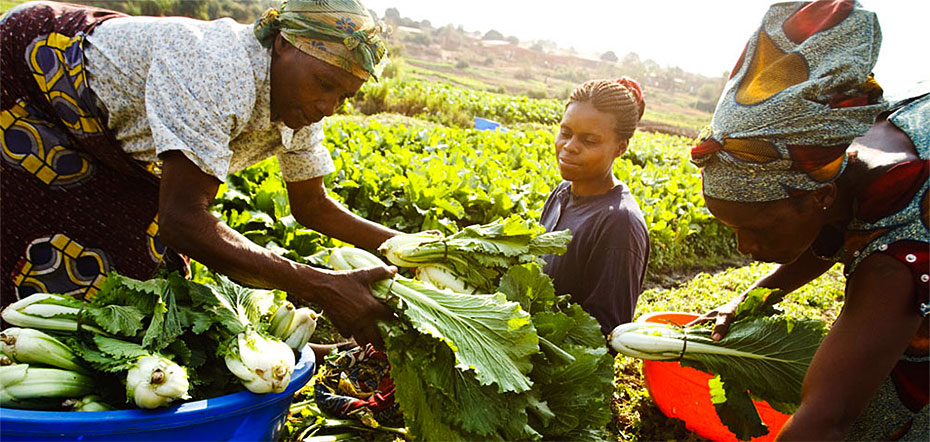
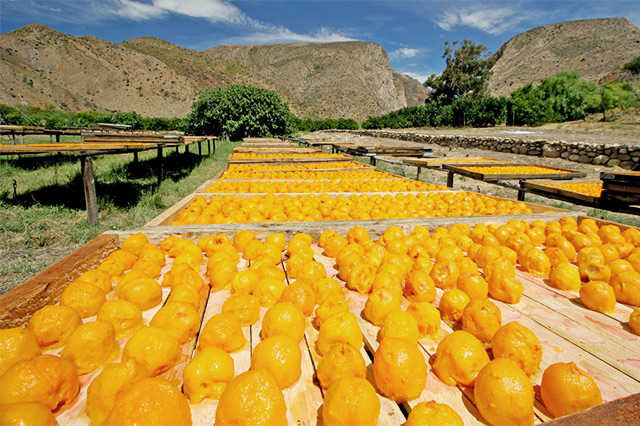
The agriculture sector forms one of the most important economic activities in Africa. While much of agricultural production is subsistence-based or for local consumption, there has been strong growth in agriculture products being exported globally.
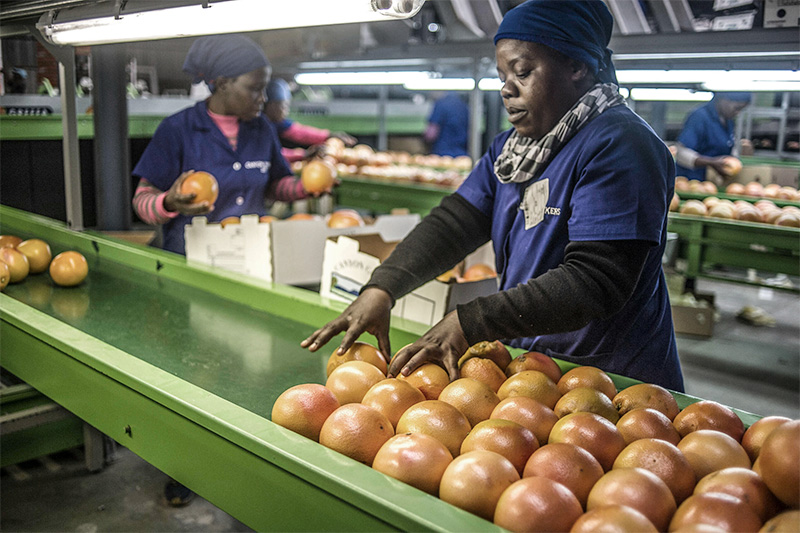
Africa’s international agriculture exports include citrus products, grains, nuts, fish, tobacco, cocoa, coffee, beverages, sugar, vegetables, fruit and many other agriculture categories. These can be found on shelves in all corners of the world, and used as inputs in further processed goods.
In terms of US exports, AGOA beneficiaries exported a combined $2.4 billion worth of agriculture products during 2016, up $750 million in 2000. However, the majority of trade continues to take place under normal tariff relations, either because products do not qualify under AGOA/GSP or because products are already subject to low or no duties when entering the US.
In 2016, approximately $440m worth of qualifying AGOA/GSP agriculture products were shipped to the US from AGOA beneficiaries. This represented just short of 20% of total agriculture products from AGOA beneficiaries to the US.
Approximately 28 AGOA beneficiary countries export agriculture products to the US. Leading exporters are Cote d’Ivoire (2016: $989m), South Africa (2016: $285m), Ghana (2016: $245m), Madagascar (2016: $237m), Ethiopia (2016: $139m) and Kenya (2016: $122m).
Leading products exported under AGOA/GSP preference are citrus fruit (mainly oranges and mandarins), grapes, nuts (including macademia), fresh vegetables, cassava and peppers. For more detail on trade in these categories, see Table 3 alongside.
More detailed data can be viewed by clicking on the table links to the right.
View related news articles
The Lady R and AGOA — take a lesson from Warren Buffet and make a case for the intrinsic value of SA Inc
Our agricultural sector’s relationship with the US is a two-way stream that is mutually beneficial based on intrinsic value. When preparing for the Agoa summit, this is the narrative we should be pushing. The comments by US Ambassador Reuben Brigety regarding theLady R shipments sent the South African currency plummeting and inflamed fears about South Africa’s future trade relations with the US. This is a high-stakes issue for...
24 May 2023
US protests Kenya’s ban on GMO products
The United States government has slammed Kenya for its failure to approve imported genetically modified (GM) foods and crops saying the measure is restricting its exports. The US Trade Representative's office (USTR) said in its annual report approval by Nairobi could boost agricultural purchases from the US by Kenya which is the world’s biggest producer of GMO crops. Kenya has been reluctant to approve the import or planting of genetically...
13 April 2022
Kenya, US set for agriculture trade deals
Kenya and US are set for agriculture trade deals. President Joe Biden’s top Agriculture minister said the US government will dispatch top agricultural officials and farmers’ representatives for a week-long trade mission in Nairobi later this year to scout for trade opportunities for American farmers and exporters. The delegation comprising businesses, farm organisations, and teams from various agriculture departments in the US government...
23 March 2022
Opinion: 'Trump vs. Biden: This is how it could impact South African agriculture'
As the race for the White House continues, agriculture leaders say a win for Democrat Joe Biden will strengthen and fast-track trade relations between South Africa and the United States. Currently, the race between pres. Donald Trump and Biden hinges on tight races in battleground states. Trump has already falsely claimed victory while Biden called for patience and every vote to be counted. Meanwhile Mzansi’s [>South Africa<]...
05 November 2020
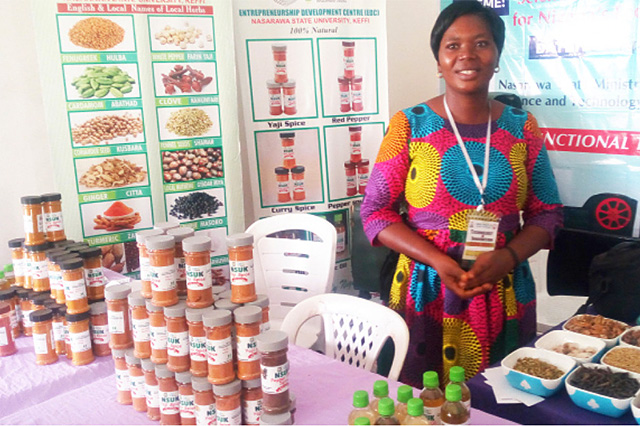
Nigeria can harvest $2bn from yearly spices export
Professor Haruna Dikko Ibrahim is the Director-General Raw Material Research and Development Council (RMRDC) Abuja. In this interview, he explains the huge potentials Nigeria can generate from the export of spices. Excerpts: Can you give us an idea into the global trade of spices? The global seasonings and spices market is on an upward trend. The spice market was valued at about USD 15.11 billion in 2017 and is expected to...
18 August 2019
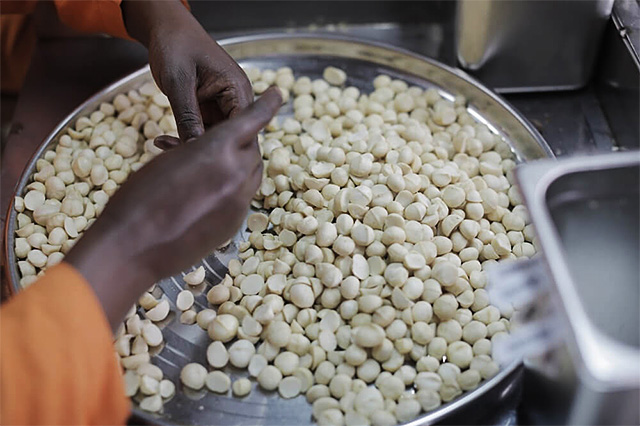
Kenya: Textile exports to the US stagnate, but macadamia exports up
Kenya's sales of macadamia nuts to the United States have soared in recent years, while textile exports have stagnated, according to new African Growth and Opportunity Act (Agoa) data. The US imported $52 million (Sh5.2 billion) worth of macadamia nuts from Kenya last year, compared to $72,000 (in purchases of the same product in 2000, the US trade agency reported last week. The agency's Agoa assessment describes the boom in Kenya's...
02 July 2018
AFDB president urges America to support African agriculture as a business
The President of the African Development Bank, Dr. Akinwumi Adesina, has made a strong case for increased American and global investments to help unlock Africa’s agriculture potential. He made the remarks as the Distinguished Guest Speaker, at the USDA’s 94th Agriculture Outlook Forum in Virginia on Thursday, on the theme The Roots of Prosperity. According to Adesina, “For too long, Agriculture has been...
27 February 2018
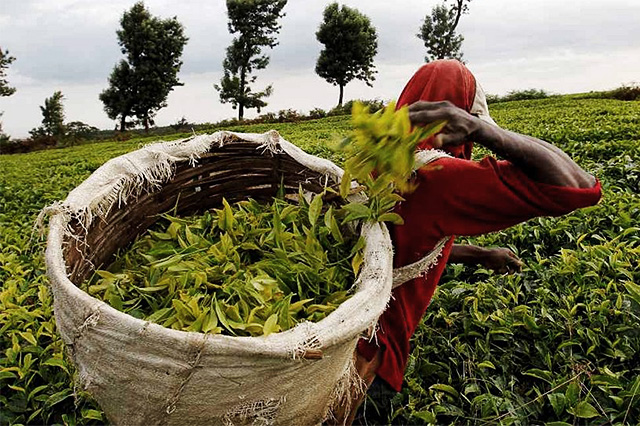
Kenya battling to get tea into the US market
Tea industry players have called for a review of the African Growth Opportunity Act to allow them access to the American market. Interim head of the tea directorate Samuel Ogola said they were negotiating to have Kenyan tea incorporated as one of the commodities for export to the market. Ogola said America is a high potential market for Kenyan tea but local traders can only benefit if they fulfill Agoa conditions. Agoa is a nonreciprocal...
07 February 2018
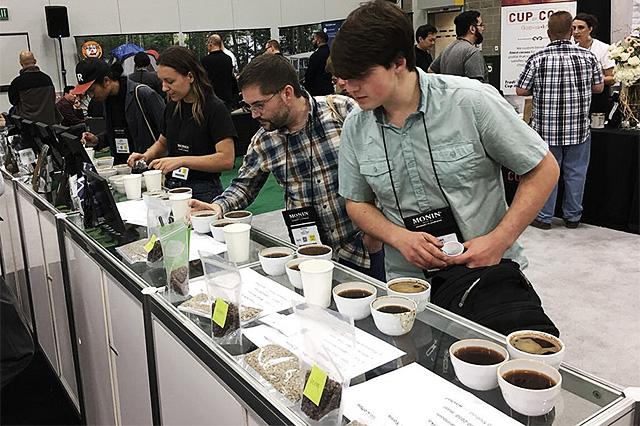
US buyers keen to source coffee from the East African region
The USAID East African Trade and Investment Hub supported East African coffee producers to connect with U.S. retailers at this month's Coffee Fest in Portland, Oregon. The October 13 - 15 event brought together a broad spectrum of the U.S. coffee industry, including roasters, retailers and coffee producers. The event helped the exhibiting companies to generate 20 solid linkages that, if realized, represent $100,000 in East African...
19 October 2017
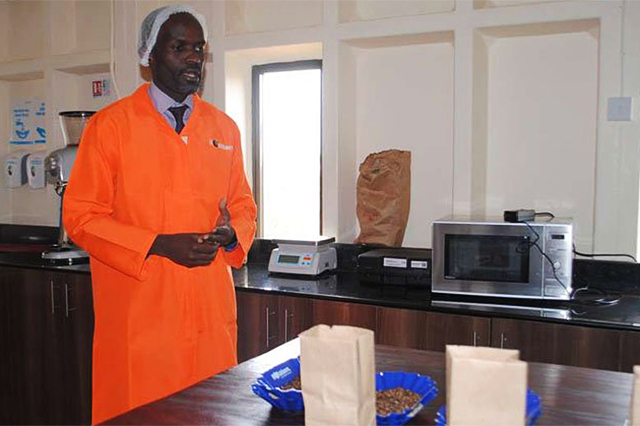
Entrepreneur uses AGOA to showcase Kenyan hope in global race for coffee billions
Hidden in the industrial godowns of Ruiru town, some 26 kilometres north of Nairobi, is a coffee story of hope — faith and endurance. Peter Muchiri, who turned 40 last August, is driving the story forward by engaging in what coffee cartels and foreign multinationals do not want Kenyans to do: add value to their green coffee and find markets abroad. “I will do it because the government appears clueless on coffee farming and markets,” he...
12 October 2017
Kenyan flower exporters prepare to seize US market opportunities
On September 14, the USAID East African Trade and Investment Hub held a Kenya Flower Stakeholders Workshop in Nairobi, Kenya to discuss U.S. market opportunities for Kenyan floriculture exporters. A total of 50 floriculture value chain stakeholders attended the meeting. Stakeholder comments from the meeting will inform the ongoing Kenya National AGOA Strategy review and the Kenya Flower Council USA market promotion action plan. The Senior...
14 September 2017