AGOA Headline Stats
Aggregate exports to US by 2024 AGOA beneficiaries - to end May 2024
-5.8% over 2023 YTD. Trade data covers only 2024 AGOA-eligible countries
AGOA exports - year to end May 2024 (-14% over 2023 YTD)
AGOA trade represents 33% of total US-bound exports from AGOA beneficiaries. (Based on 2024 eligible countries)
AGOA eligible tariff-lines (incl. textiles and apparel)
Products that have duty-free access to the United States under AGOA (subject to Rules of Origin and textile provisions)
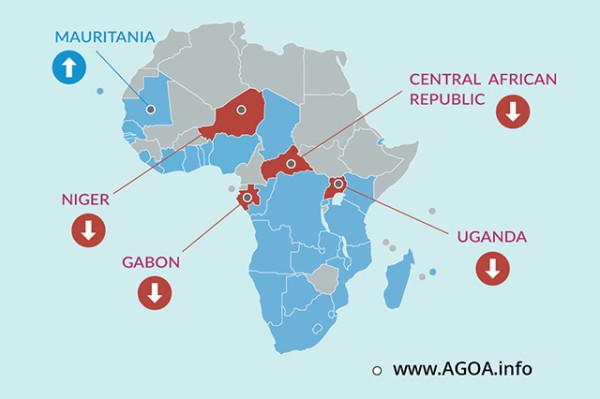
Number of AGOA beneficiary countries
African countries that currently have AGOA beneficiary status (Status: January 2024)











![Ruto's State visit spotlights Kenya's centrality to Africa-US relations [Download Facsheet] Ruto's State visit spotlights Kenya's centrality to Africa-US relations [Download Facsheet]](https://agoa.info/images/articles/16464/_thumb2/rutobiden2024.jpg)







![US senators introduce bill to renew Africa trade pact through 2041 [Download copy] US senators introduce bill to renew Africa trade pact through 2041 [Download copy]](https://agoa.info/images/articles/16451/_thumb2/coonssenatepress.jpg)
![AGOA Forum 2023: Digital press briefing with officials in the USTR and State Department [Transcript] AGOA Forum 2023: Digital press briefing with officials in the USTR and State Department [Transcript]](https://agoa.info/images/articles/16344/_thumb2/ustr-blue.jpg)
![Department of Trade, Industry and Competition invites media to apply for accreditation for upcoming AGOA Forum [Deadline 8 October 2023] Department of Trade, Industry and Competition invites media to apply for accreditation for upcoming AGOA Forum [Deadline 8 October 2023]](https://agoa.info/images/articles/16311/_thumb2/dtic.jpg)
![** AGOA eligibility review 2023 (for year 2024): Timelines of hearings and request for comments ** [Deadline written submissions 7 July] ** AGOA eligibility review 2023 (for year 2024): Timelines of hearings and request for comments ** [Deadline written submissions 7 July]](https://agoa.info/images/articles/16212/_thumb2/ustrlogo.jpg)
![A proclamation to take certain actions under AGOA and for other purposes [Burkina Faso] A proclamation to take certain actions under AGOA and for other purposes [Burkina Faso]](https://agoa.info/images/articles/16125/_thumb2/whitehouselogo.jpg)
